Imagine a city with its own ecosystem of information, that helps its residents become more informed and involved. Its government is more transparent, accountable and efficient. Public services grow more effective and its private sector innovates and flourishes.
Those are OpenDataPhilly’s goals, in a nutshell. The initiative aims to provide a place where Philadelphians can find the data most beneficial to them in the format that best suits their needs. Borrowing from the field of design research, however, could allow ODDT to revamp this resource in order to reach a greater number of residents. ODDT fellows Miguel Perez and Vito Salerno have worked to help make the City’s data more accessible.
Building a better portal
If the network of people and information in Philadelphia is an ecosystem, Perez is its ecologist. As a user experience fellow, he surveys those who have used open data in order to understand how it plays a part in their lives and work. Since starting with the City as a fellow in early May, Perez has spoken to data journalists, academic researchers community leaders, urban planners, and an epidemiologist, among others.
He looks for patterns of inefficiency that can make accessing this critical data slow, frustrating or, at times, impossible. Differing levels of technical skill, a constricted search functionality, fostering collaboration, out-of-date information can all create obstacles to using data in meaningful ways. In order to reach a broader user base, the data portal must evolve from a directory of downloadable files.
“The datasets themselves are just tools that can be used in many different ways. In order to get anything done you need more than a bag of hammers,” Perez said. “You need people, you need reasons, you need a problem that you want to solve.”
One of Perez’s observations is that the current data network creates too much wasted human effort. For example, a journalist could request a dataset, clean and normalize it (i.e. spell an organization’s name the same wherever it appears), then let it sit on their computer. Later, a different journalist in the same newsroom could end up requesting, cleaning and normalizing the same dataset without knowing it has already been improved upon. Similar problems can occur within city government, making it harder for different departments to use each other’s research effectively.
Perez’s job is to empower networks of people by finding ways to make browsing and sharing data more intuitive. Improving the website’s search function and incorporating more interactive visualizations are steps in fixing these inefficiencies.
Transforming data
Before government data is ready to be uploaded to the portal, it’s often raw – addresses may need a latitude and longitude; license plate numbers and other private information needs to be replaced with an anonymous identifier. Even simple discrepancies like “Philly,” “Phila.” and “Philadelphia” need to be made consistent before datasets can be useable.
Data engineer fellow Vito Salerno is here to ensure that government data is in its best shape before it hits OpenDataPhilly.org. He writes programs that clean, anonymize or enhance departments’ datasets to make them clearer and easier to use. For instance, in order to help the Department of Finance publish the proposed city budget, Salerno and the Open Data team needed to extract the raw data from a Microsoft Word document and place it into a spreadsheet. Still, spreadsheets aren’t the most revealing – or exciting – format.
“Having just rows of data isn’t necessarily that useful unless you’re like looking for a specific piece of information,” Salerno said. “If you want to see patterns, you need visualizations.”
So the Fiscal Year 2018 budget proposal that was parsed out of the Word document has been loaded into the City’s open budget visualization.
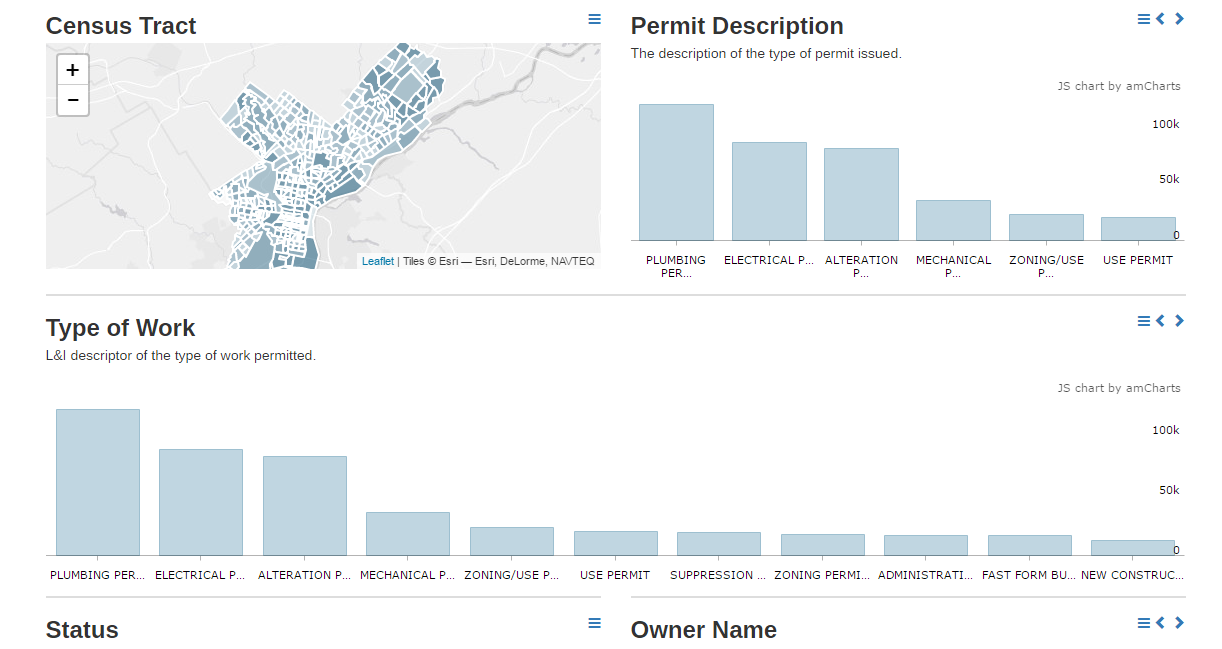
Salerno also used an open-source visualization tool called VizWit to create other visualizations, such as one on License and Inspections (L&I) building permits. But if someone is looking to do their own in-depth analysis – Salerno also has those spreadsheets and shapefiles ready to go.
In the short time they have been with the ODDT team, Salerno and Perez have made strides in helping make open data an easy to use resource for more Philadelphians. Next in this series: learn about ODDT’s next steps and how to get involved with the team.